DATA MONITOR ON ALLISON DOC SOFTWARE
Aliison DOC Software
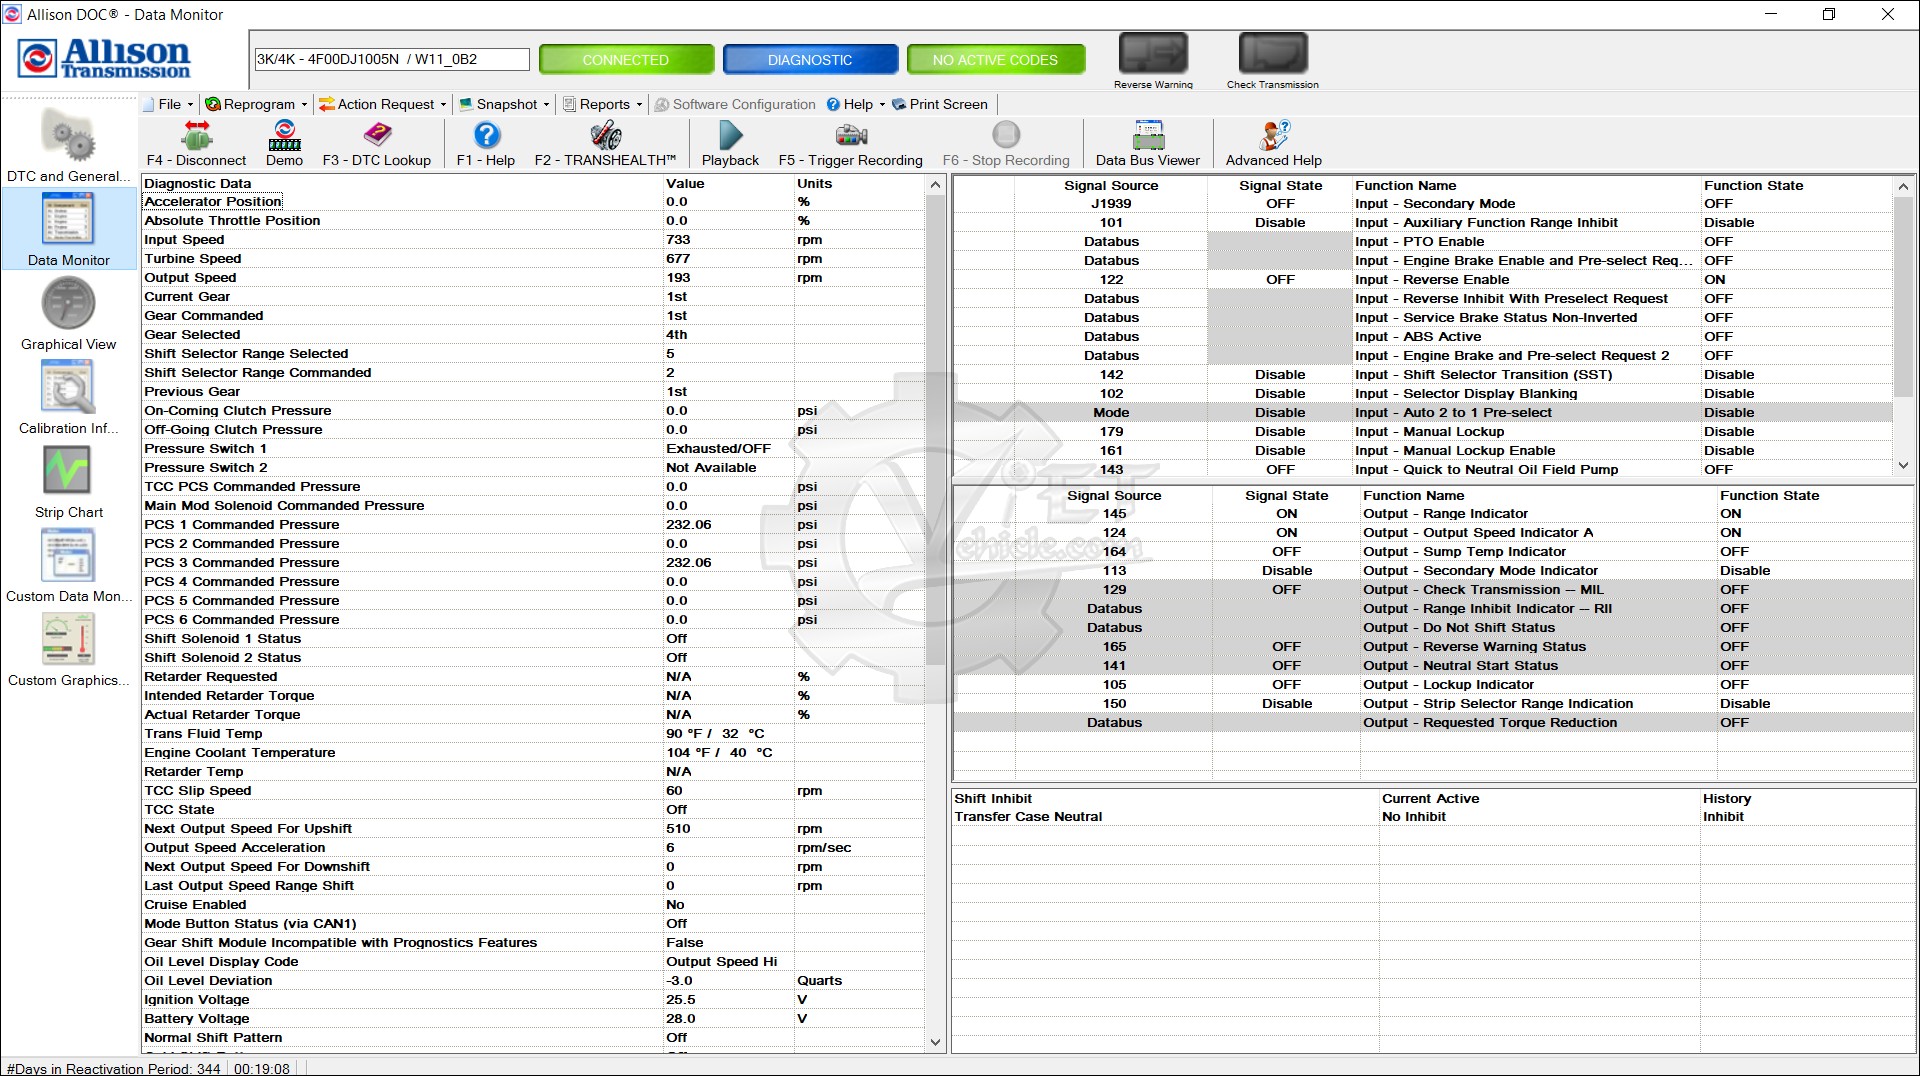
The Data Monitor allows you to view controller information in a table format. The data display is dynamic and displays real-time data as it occurs. This screen is divided into four major grids: Diagnostic Data (left side), Input Functions (upper right side), Output Functions (center right side), and Shift Inhibits (lower right side).
Diagnostic Data
- Diagnostic Data -A brief description of the diagnostic data being measured.
- Value - The value of the associated diagnostic data.
- Units - Units of measure for the value.
Input/Output Functions
- Signal Source - The wire circuit number assigned to the programmed function or the specific databus from which the signal is being received.
- Wire/ Databus - The wire circuit number assigned to the programmed function. if Databus is displayed, the function is not assigned to a wire but is being controlled (turned On/Off) via the communication Databus.
- Signal State/ Wire State - Displays the state of the wire (On/Off) or if the wire is Disabled. The Signal State is grayed-out when the state cannot be determined.
- Function Name - Indicates if the function is an input or output and lists the Function Name. Double-click on Function Name to launch the troubleshooting manual for that function.
- Function State - Displays state of the function (On/Off) or if the function is Disabled.
Note: Grayed rows indicate I/O functions and wires that cannot be reprogrammed.
Shift Inhibits
- Inhibit - Displays the condition(s) that is or was causing the Shift Inhibit.
- Current Active - Indicates whether a particular condition is currently inhibiting shifts.
- History - Indicates that, since the last DTC clear, a particular condition has inhibited shifts.
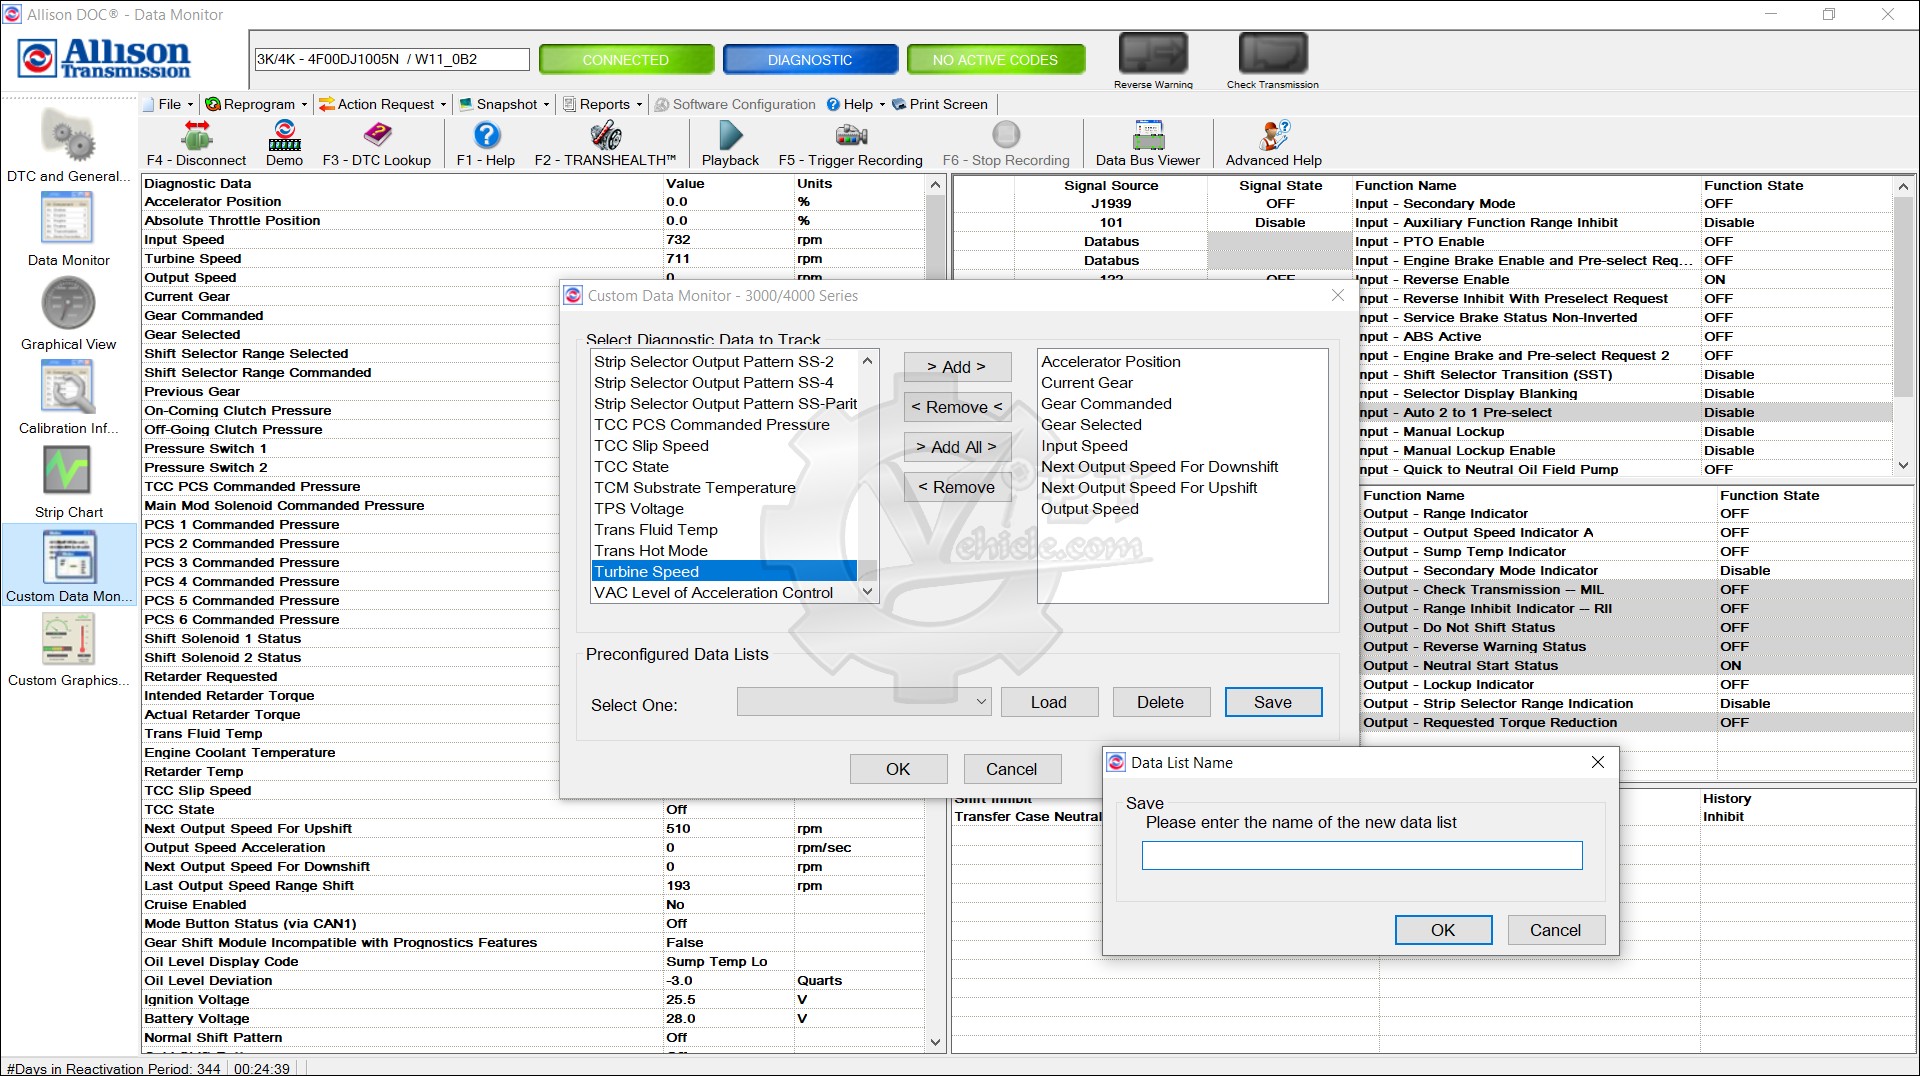
Custom Data Monitor
You may select the information to be displayed in the Custom Data Monitor window by adding or removing Transmission parameters to the display. Each control system has a unique list of Transmission parameters.
Transmission parameters are added or removed in the Custom Data Monitor data selection window. The Custom Data Monitor window is the same as the Data Monitor window, except that only the selected data is displayed.

To Select Custom Data Monitor Transmission Parameters
1). Select the Custom Data Monitor button - the Custom Data Monitor data selection window displays.
2). Select the desired Transmission parameter(s) from the left-hand column.
3). Click the =>Add => button or double click the selection - the selected Transmission parameters appear in the right-hand column.
4). Click the =>Add All => button to add all the Transmission parameters.
5). Click the OK button - the selected Transmission parameters appear in the Custom Data Monitor window.
To Remove Customer Data Monitor Transmission Parameters
1). Select the desired Transmission parameter(s) from the right-hand column.
2). Click the <= Remove <= button - the selected Transmission parameters are restored to the left-hand column.
3). Click the <= Remove button to remove all the Transmission parameters.
4). Click the OK button - the deleted Transmission parameters no longer appear in the Custom Data Monitor window and the Custom Data Monitor data selection window closes.

Preconfigured Data List
You can save a list of Transmission parameters for display in the Custom Data Monitor by using the Preconfigured Data List feature.
1). Click on the Save button - the Data List Name dialog box displays.
2). Type a unique name for the saved data list and click OK.

Please fill in the form below, so we can provide you with an up-to-date information about our new arrivals.